
JavaScript 代码调试
JavaScript 代码调试实战
Chrome DevTools
copy(objectName);
Learn How To Debug JavaScript with Chrome DevTools
除了console.log,debugger就是另一个我很喜欢的快速调试的工具,将 debugger 加入代码之后,Chrome 会自动在插入它的地方停止,很像 C 或者 Java 里面打断点。你也可以在一些条件控制中插入该调试语句,譬如:
if (thisThing) {
  debugger;
}
格式化被压缩的代码
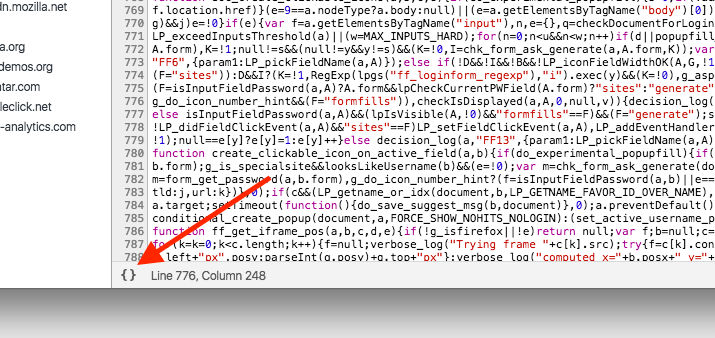
有时候在生产环境下我们发现了一些莫名奇妙的问题,然后忘了把 sourcemaps 放到这台服务器上,或者在看别人家的网站的源代码的时候,结果就看到了一坨不知道讲什么的代码,就像下图。Chrome 为我们提供了一个很人性化的反压缩工具来增强代码的可读性,大概这么用:
基于 VSCode 的 Node.js/React 应用断点调试与单步执行
VS Code 是微软开源的现代化、跨平台、轻量级的代码编辑器,我们在 JavaScript 应用开发的过程中也作为首选的 IDE,本部分我们介绍如何使用 VS Code 进行应用的断点调试与单步执行。官方文档
Node.js
function sayHello() {
  console.log("Hello World");
}

sayHello();
const Koa = require("koa");
const app = new Koa();

app.use((ctx) => {
  ctx.body = "Hello, World!";
});

app.listen(3000);
$ curl localhost:3000
点击 VSCode 工具栏中的调试-打开工具,可以看到 launch.json 文件,其默认配置如下:
{
  // Use IntelliSense to learn about possible Node.js debug attributes.
  // Hover to view descriptions of existing attributes.
  // For more information, visit: https://go.microsoft.com/fwlink/?linkid=830387
  "version": "0.2.0",
  "configurations": [
    {
      "type": "node",
      "request": "launch",
      "name": "Launch Program",
      "program": "${file}"
    }
  ]
}
值得一提的是,VSCode 允许添加条件断点,即执行到该行代码满足特定条件后程序才会中断。在断点小红点上右键选择编辑断点,可以选择两种条件,也可以组合表达式和命中次数条件一起使用:
- 表达式:当表达式计算结果为 true 时中断;
- 命中次数:同样当表达式计算结果为 true 时中断,支持运算符 <, <=, ==, >, >=, %。如 >10:即执行 10 次以后断点才会生效
launch.json 调试配置
launch.json 其实就是存储了一些调试相关的配置。VS Code 启动调试时,会读取 launch.json 决定以何种方式调试。launch.json 有以下常用选项:
{
  "version": "0.2.0",
  "configurations": [
    {
      "type": "node",
      "request": "launch",
      "name": "Launch Program",
      "program": "${file}",
      "cwd": "${workspaceFolder}"
    },
    {
      "type": "node",
      "request": "attach",
      "name": "Attach to Process",
      "port": 5858
    }
  ]
}
-
必需字段:
- type:调试器类型。这里是 node(内置的调试器),如果装了 Go 和 PHP 的扩展后对应的 type 分别为 go 和 php
- request:请求的类型,目前只支持 launch 和 attach。launch 就是以 debug 模式启动调试,attach 就是附加到已经启动的进程开启 debug 模式并调试,跟上一篇提到的用 node -e “process._debugProcess(PID)” 作用一样
- name:下拉菜单显示的名字
-
可选字段(括号里表示适用的类型):
- program:可执行文件或者调试器要运行的文件 (launch)
- args:要传递给调试程序的参数 (launch)
- env:环境变量 (launch)
- cwd:当前执行目录 (launch)
- address:ip 地址 (launch & attach)
- port:端口号 (launch & attach)
- skipFiles:想要忽略的文件,数组类型 (launch & attach)
- processId:进程 PID (attach)
- 变量替换:
- ${workspaceRoot}:当前打开工程的路径
- ${file}:当前打开文件的路径
- ${fileBasename}:当前打开文件的名字,包含后缀名
- ${fileDirname}:当前打开文件所在的文件夹的路径
- ${fileExtname}:当前打开文件的后缀名
- ${cwd}:当前执行目录
我们也可以使用如下方式指明应用程序的启动位置
{
    ...
    "configurations": [
        {
            ...
            "program": "${workspaceRoot}/app.js"
        }
    ]
}
我们也可以自己指定启动的目标文件:
{
    ...
    "configurations": [
        {
            ...
            "program": "./node_modules/gulp/bin/gulpfile.js",
            "args": ["myFolder/path/app.js"],
            "windows": {
                "args": ["myFolder\\path\\app.js"]
            }
        }
    ]
}
注意,这里需要针对 Windows、Linux 系统中不同的文件路径分隔符指定不同的路径。较为常用的 lanuch.json 中的自定义配置即是设置 skipFiles,即在显示当前断点的调用堆栈时候忽略某些 node_modules 中或者不关心的代码:
{
    "version": "0.2.0",
    "configurations": [
        {
            ...
            "skipFiles": [
                "${workspaceRoot}/node_modules/**/*.js",
                "<node_internals>/**/*.js"
            ]
        }
    ]
}
TypeScript
这篇文章中也介绍了如何在 VSCode 中调试 TypeScript 程序
require('ts-node').register();
// Now we can load and run ./my-typescript-code.ts...
require('./my-typescript-code');
React
{
  "version": "0.2.0",
  "configurations": [
    {
      "name": "Chrome",
      "type": "chrome",
      "request": "launch",
      "url": "http://localhost:3000",
      "webRoot": "${workspaceRoot}"
    }
  ]
}
控制台与日志
由于 console.log 是异步执行,可能会导致用户打印的结果与预期结果出现不一致:
const a = { x: 1 };
console.log(a);
a.x++;

// 控制台输出
{
  x: 1;
}
x: 2;
__proto__: Object;
const b = { x: 1 };
console.log({ ...b });
b.x++;

// 控制台输出
{
  x: 1;
}
x: 1;
__proto__: Object;
格式化输出
将 Objects 以表格形式展示
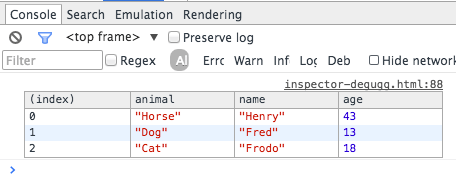
有时候我们需要看一些复杂的对象的详细信息,最简单的方法就是用console.log然后展示成一个列表状,上下滚动进行浏览。不过似乎用console.table展示成列表会更好呦,大概是介个样子:
var animals = [
  { animal: "Horse", name: "Henry", age: 43 },
  { animal: "Dog", name: "Fred", age: 13 },
  { animal: "Cat", name: "Frodo", age: 18 },
];

console.table(animals);
在较复杂的调试情况下发现关键元素
在一些复杂的调试环境下我们可能要输出很多行的内容,这时候我们习惯性的会用 console.log, console.debug, console.warn, console.info, console.error 这些来进行区分,然后就可以在 Inspector 中进行过滤。不过有时候我们还是希望能够自定义显示样式,你可以用 CSS 来定义个性化的信息样式:
console.todo = function(msg) {
console.log(' % c % s % s % s', 'color: yellow; background - color: black;', '–', msg, '–');
}

console.important = function(msg) {
console.log(' % c % s % s % s', 'color: brown; font - weight: bold; text - decoration: underline;', '–', msg, '–');
}

console.todo(“This is something that' s need to be fixed”);
console.important('This is an important message');
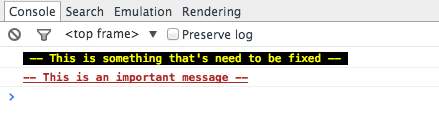
在console.log()中你可以使用%s来代表一个字符串, %i 来代表数字,以及 %c 来代表自定义的样式。
调用追踪
获取某个函数的调用追踪记录
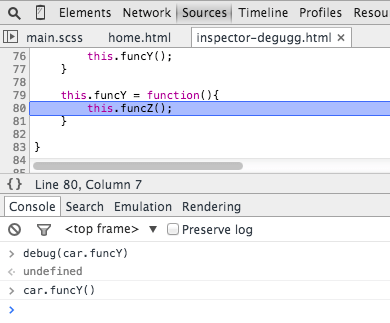
JavaScript 框架极大方便了我们的开发,但是也会带来大量的预定义的函数,譬如创建 View 的、绑定事件的等等,这样我们就不容易追踪我们自定义函数的调用过程了。虽然 JavaScript 不是一个非常严谨的语言,有时候很难搞清楚到底发生了啥,特别是当你需要审阅其他人的代码的时候。这时候console.trace就要起作用咯,它可以帮你进行函数调用的追踪。譬如下面的代码中我们要追踪出 car 对象中对于 funcZ 的调用过程:
var car;

var func1 = function () {
  func2();
};

var func2 = function () {
  func4();
};

var func3 = function () {};

var func4 = function () {
  car = new Car();
  car.funcX();
};

var Car = function () {
  this.brand = "volvo";
  this.color = "red";

  this.funcX = function () {
    this.funcY();
  };

  this.funcY = function () {
    this.funcZ();
  };

  this.funcZ = function () {
    console.trace("trace car");
  };
};

func1();

快速定位调试函数
当我们想在函数里加个断点的时候,一般会选择这么做:
- 在 Inspector 中找到指定行,然后添加一个断点
- 在脚本中添加一个 debugger 调用
不过这两种方法都存在一个小问题就是都要到对应的脚本文件中然后再找到对应的行,这样会比较麻烦。这边介绍一个相对快捷点的方法,就是在 console 中使用debug(funcName)然后脚本会在指定到对应函数的地方自动停止。这种方法有个缺陷就是无法在私有函数或者匿名函数处停止,所以还是要因时而异:
var func1 = function () {
  func2();
};

var Car = function () {
  this.funcX = function () {
    this.funcY();
  };

  this.funcY = function () {
    this.funcZ();
  };
};

var car = new Car();
DOM 辅助
远程调试
Google Developer Tools
Goggle’s developer tools allow you to inspect any web page running in Chrome on Android by connecting the Android device (only 4.0 and newer) to your computer via USB. On your computer, you’ll also need Chrome. To set this up, enable USB debugging on the device, and in your computer’s Chrome, browse to chrome://inspect to discover the device. After you’ve allowed the desktop access on the device, you can inspect and debug any web page that is viewed in Chrome on the device.

Safari
This is possible for iOS as well, Safari to Safari. You also need to connect your device to the computer with USB. In the advanced Safari settings on the device, enable the option “Web Inspector”. Then open Safari on your computer, and in the “Developer” menu, you’ll see a list of iOS devices currently connected to your computer by cable. For each device, you’ll be able to inspect and debug any web page that is being displayed in Safari.

Weinre
Portable Console
在 Console 快速选定 DOM 元素
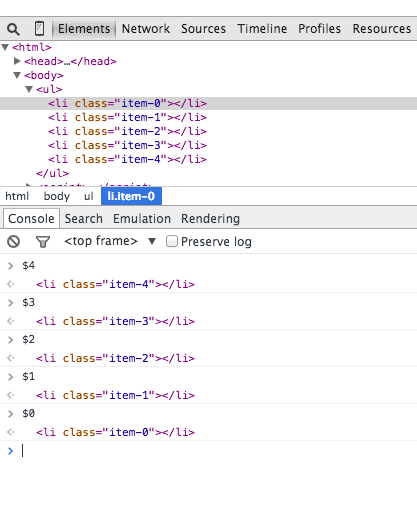
在 Elements 选择面板中选择某个 DOM 元素然后在 Console 中使用该元素也是非常常见的一个操作,Chrome Inspector 会缓存最后 5 个 DOM 元素在它的历史记录中,你可以用类似于 Shell 中的$0等方式来快速关联到元素。譬如下图的列表中有’item-4′, ‘item-3’, ‘item-2’, ‘item-1’, ‘item-0’这几个元素,你可以这么使用:
禁止不相关的脚本运行
当我们开发现代网页的时候都会用一些第三方的框架或者库,它们几乎都是经过测试并且相对而言 Bug 较少的。不过当我们调试我们自己的脚本的时候也会一不小心跳到这些文件中,引发额外的调试任务。解决方案呢就是禁止这部分不需要调试的脚本运行,详情可见这篇文章:javascript-debugging-with-black-box。
监测指定函数的调用与参数
在 Chrome 中可以监测指定函数的调用情况以及参数:
var func1 = function(x, y, z) {
};
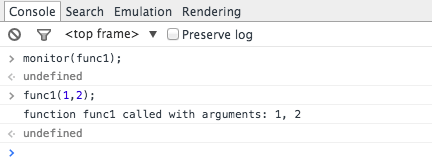
这种方式能够让你实时监控到底啥参数被传入到了指定函数中。
Console 中使用$进行元素查询
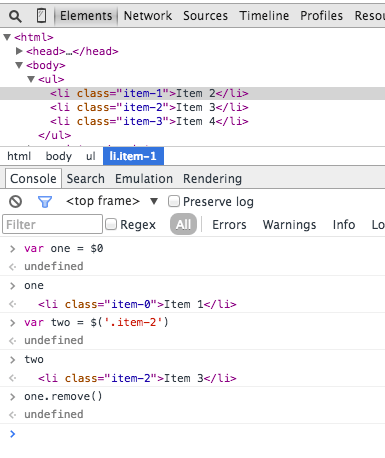
在 Console 中也可以使用$来进行类似于 querySelector 那样基于 CSS 选择器的查询,$(‘css-selector’) 会返回满足匹配的第一个元素,而$$(‘css-selector’) 会返回全部匹配元素。注意,如果你会多次使用到元素,那么别忘了将它们存入变量中。
Postman
很多人习惯用 Postman 进行 API 调试或者发起 Ajax 请求,不过别忘了你浏览器自带的也能做这个,并且你也不需要担心啥认证啊这些,因为 Cookie 都是自带帮你传送的,这些只要在 network 这个 tab 里就能进行,大概这样子:
DOM 变化检测
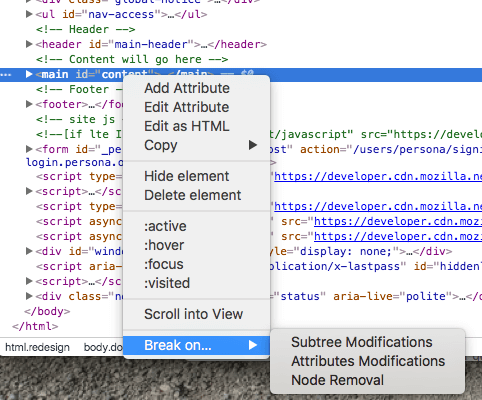
DOM 有时候还是很操蛋的,有时候压根不知道啥时候就变了,不过 Chrome 提供了一个小的功能就是当 DOM 发生变化的时候它会提醒你,你可以监测属性变化等等:
console
console.log('hello');
console.info('信息');
console.error('错误');
console.warn('警告');
console 上述的集中度支持 printf 的占位符格式,支持的占位符有:字符(%s)、整数(%d 或%i)、浮点数(%f)和对象(%o)
<script type="text/javascript">
  console.log("%d年%d月%d日",2011,3,26);
</script>
效果:

信息分组
console.group("第一组信息");
console.log("第一组第一条:我的博客(http://www.ido321.com)");
console.log("第一组第二条:CSDN(http://blog.csdn.net/u011043843)");
console.groupEnd();
console.group("第二组信息");
console.log("第二组第一条:程序爱好者QQ群: 259280570");
console.log("第二组第二条:欢迎你加入");
console.groupEnd();

console.dir()可以显示一个对象所有的属性和方法。
var info = {
   blog:"http://www.ido321.com",
   QQGroup:259280570,
   message:"程序爱好者欢迎你的加入"
   };
   console.dir(info);

显示某个节点的内容
<div id="info">
  <h3>我的博客:www.ido321.com</h3>
  <p>程序爱好者:259280570,欢迎你的加入</p>
</div>
<script type="text/javascript">
  var info = document.getElementById('info');
  console.dirxml(info);
</script>

console.assert()用来判断一个表达式或变量是否为真。如果结果为否,则在控制台输出一条相应信息,并且抛出一个异常。
var result = 1;
console.assert(result);
var year = 2014;
console.assert(year == 2018);

console.trace()用来追踪函数的调用轨迹。
<script type="text/javascript">
  /*函数是如何被调用的,在其中加入console.trace()方法就可以了*/
  function add(a, b) {
    console.trace();
    return a + b;
  }
  var x = add3(1, 1);
  function add3(a, b) {
    return add2(a, b);
  }
  function add2(a, b) {
    return add1(a, b);
  }
  function add1(a, b) {
    return add(a, b);
  }
</script>

console.time()和 console.timeEnd(),用来显示代码的运行时间。
<script type="text/javascript">
    console.time("控制台计时器一");
    for(var i=0;i<1000;i++){
       for(var j=0;j<1000;j++){}
    }
    console.timeEnd("控制台计时器一");
</script>

console.profile()的性能分析性能分析(Profiler)就是分析程序各个部分的运行时间,找出瓶颈所在,使用的方法是 console.profile()。
   function All(){
   alert(11);
   for(var i=0;i<10;i++){
     funcA(1000);
   }
   funcB(10000);

function funcA(count){
for(var i=0;i<count;i++){}
}
function funcB(count){
for(var i=0;i<count;i++){}
}
console.profile('性能分析器');
All();
console.profileEnd();
