
top
top
使用 top 命令,可以查看到 CPU 利用率、CPU 平均负载这两个指标。
# 指定查看用户,键入数字 1 查看单个 CPU 的负载,P/M/T 分别切换按照 CPU、内存、CPU 占用时间排序
$ top -u oracle

# Cpu(s): 87.3%us,  1.2%sy,  0.0%ni, 27.6%id,  0.0%wa,  0.0%hi,  0.0%si,  0.0%st
us: user cpu time (or) % CPU time spent in user space
sy: system cpu time (or) % CPU time spent in kernel space
ni: user nice cpu time (or) % CPU time spent on low priority processes
id: idle cpu time (or) % CPU time spent idle
wa: io wait cpu time (or) % CPU time spent in wait (on disk)
hi: hardware irq (or) % CPU time spent servicing/handling hardware interrupts
si: software irq (or) % CPU time spent servicing/handling software interrupts
st: steal time - - % CPU time in involuntary wait by virtual cpu while hypervisor is servicing another processor (or) % CPU time stolen from a virtual machine

# 表格列

# PID:进程的ID
# USER:进程所有者
# PR:进程的优先级别,越小越优先被执行
# NInice:值
# VIRT:进程占用的虚拟内存
# RES:进程占用的物理内存
# SHR:进程使用的共享内存
# S:进程的状态。S表示休眠,R表示正在运行,Z表示僵死状态,N表示该进程优先值为负数
# %CPU:进程占用CPU的使用率
# %MEM:进程使用的物理内存和总内存的百分比
# TIME+:该进程启动后占用的总的CPU时间,即占用CPU使用时间的累加值。
# COMMAND:进程启动命令名称
第一行显示的内容:当前时间、系统运行时间以及正在登录用户数。load average 后的三个数字,依次表示过去 1 分钟、5 分钟、15 分钟的平均负载(Load Average)。平均负载是指单位时间内,系统处于可运行状态(正在使用 CPU 或者正在等待 CPU 的进程,R 状态)和不可中断状态(D 状态)的平均进程数,也就是平均活跃进程数,它和 CPU 使用率并没有直接关系。
第三行的内容表示 CPU 利用率,每一列的含义可以使用 man 查看。CPU 使用率体现了单位时间内 CPU 使用情况的统计,以百分比的方式展示。计算方式为:CPU 利用率 = 1 -(CPU 空闲时间)/ CPU 总的时间。需要注意的是,通过性能分析工具得到的 CPU 的利用率其实是某个采样时间内的 CPU 平均值。注:top 工具显示的的 CPU 利用率是把所有 CPU 核的数值加起来的,即 8 核 CPU 的利用率最大可以到达 800%(可以用 htop 等更新一些的工具代替 top)。
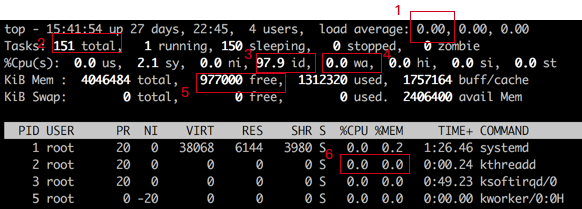
1 处表示系统负载,它表示当前正在等待被 cpu 调度的进程数量,这个值小于系统 vcpu 数(超线程数)的时候是比较正常的,一旦大于 vcpu 数,则说明并发运行的进程太多了,有进程迟迟得不到 cpu 时间。这种情况给用户的直观感受就是敲任何命令都卡。
2 处表示当前系统的总进程数,通常该值过大的时候就会导致 load average 过大。
3 处表示 cpu 的空闲时间,可以反应 cpu 的繁忙程度,该值较高时表示系统 cpu 处于比较清闲的状态,如果该值较低,则说明系统的 cpu 比较繁忙。需要注意的是,有些时候该值比较高,表示 cpu 比较清闲,但是 load average 依然比较高,这种情况很可能就是因为进程数太多,进程切换占用了大量的 cpu 时间,从而挤占了业务运行需要使用的 cpu 时间。
4 处表示进程 IO 等待的时间,该值较高时表示系统的瓶颈可能出现在磁盘和网络。
5 处表示系统的剩余内存,反应了系统的内存使用情况。
6 处表示单个进程的 cpu 和内存使用情况。关于 top 命令中各个指标含义的进一步描述可以参见:
此外,我们也可以使用扩展 htop 或者 glances;如果针对容器监控,可以使用 ctop。
➊ 在命令行输入 top,然后 shift+p 查看占用 CPU 最高的进程,记下进程号 ➋ 在命令行输入 top -Hp 进程号,查看占用 CPU 最高的线程 ➌ 使用 printf 0x%x 线程号,得到其 16 进制线程号 ➍ 使用 jstack 进程号得到 java 执行栈,然后 grep16 进制找到相应的信息
ps -eo %cpu,pid |sort -n -k1 -r | head -n 1 | awk ‘{print $2}’ |xargs top -b -n1 -Hp | grep COMMAND -A1 | tail -n 1 | awk ‘{print $1}’ | xargs printf 0x%x
找到使用 CPU 最高的进程之使用 CPU 最高的线程的 16 进制号。
➊ 如果 load 超过了 cpu 核数,则负载过高 ➋ 如果 wa 过高,可初步判断 IO 有问题 ➌ sy,si,hi,st,任何一个超过 5%,都有问题 ➍ 进程状态长时处于 D、Z、T 状态,提高注意度 ➎ cpu 不均衡,判断亲和性和优先级问题 ➊ 如果 load 超过了 cpu 核数,则负载过高 ➋ 如果 wa 过高,可初步判断 IO 有问题 ➌ sy,si,hi,st,任何一个超过 5%,都有问题 ➍ 进程状态长时处于 D、Z、T 状态,提高注意度 ➎ cpu 不均衡,判断亲和性和优先级问题
除了关注类似 top 的一些指标,还有: ➊ b 置于等待队列(等待资源、等待输入/输出)的内核线程数目。数字过大则 cpu 太忙。 ➋ cs 如果频繁的进行上下文切换,则考虑是否是线程数开的过多 ➌ si/so 显示了交换分区的现状,有时候会造成 cpu 问题,一并关注