
2021-GDB 调试指南
GDB 调试指南
启动调试
前言
GDB(GNU Debugger)是 UNIX 及 UNIX-like 下的强大调试工具,可以调试 ada, c, c++, asm, minimal, d, fortran, objective-c, go, java,pascal 等语言。本文以 C 程序为例,介绍 GDB 启动调试的多种方式。
哪类程序可被调试
对于 C 程序来说,需要在编译时加上-g 参数,保留调试信息,否则不能使用 GDB 进行调试。 但如果不是自己编译的程序,并不知道是否带有-g 参数,如何判断一个文件是否带有调试信息呢?
gdb 文件
例如:
$ gdb helloworld
Reading symbols from helloWorld...(no debugging symbols found)...done.
如果没有调试信息,会提示 no debugging symbols found。 如果是下面的提示:
Reading symbols from helloWorld...done.
则可以进行调试。
readelf 查看段信息
例如:
$ readelf -S helloWorld|grep debug
  [28] .debug_aranges    PROGBITS         0000000000000000  0000106d
  [29] .debug_info       PROGBITS         0000000000000000  0000109d
  [30] .debug_abbrev     PROGBITS         0000000000000000  0000115b
  [31] .debug_line       PROGBITS         0000000000000000  000011b9
  [32] .debug_str        PROGBITS         0000000000000000  000011fc
helloWorld 为文件名,如果没有任何 debug 信息,则不能被调试。
file 查看 strip 状况
下面的情况也是不可调试的:
file helloWorld
helloWorld: (省略前面内容) stripped
如果最后是 stripped,则说明该文件的符号表信息和调试信息已被去除,不能使用 gdb 调试。但是 not stripped 的情况并不能说明能够被调试。
调试方式运行程序
程序还未启动时,可有多种方式启动调试。
调试启动无参程序
例如:
$ gdb helloWorld
(gdb)
输入 run 命令,即可运行程序
调试启动带参程序
假设有以下程序,启动时需要带参数:
#include<stdio.h>
int main(int argc,char *argv[])
{
    if(1 >= argc)
    {
        printf("usage:hello name\n");
        return 0;
    }
    printf("Hello World %s!\n",argv[1]);
    return 0 ;
}
编译:
gcc -g -o hello hello.c
这种情况如何启动调试呢?需要设置参数:
$ gdb hello
(gdb)run 编程珠玑
Starting program: /home/shouwang/workspaces/c/hello 编程珠玑
Hello World 编程珠玑!
[Inferior 1 (process 20084) exited normally]
(gdb)
只需要 run 的时候带上参数即可。 或者使用 set args,然后在用 run 启动:
gdb hello
(gdb) set args 编程珠玑
(gdb) run
Starting program: /home/hyb/workspaces/c/hello 编程珠玑
Hello World 编程珠玑!
[Inferior 1 (process 20201) exited normally]
(gdb)
调试 core 文件
当程序 core dump 时,可能会产生 core 文件,它能够很大程序帮助我们定位问题。但前提是系统没有限制 core 文件的产生。可以使用命令 limit -c 查看:
$ ulimit -c
0
如果结果是 0,那么恭喜你,即便程序 core dump 了也不会有 core 文件留下。我们需要让 core 文件能够产生:
ulimit -c unlimied  #表示不限制core文件大小
ulimit -c 10        #设置最大大小,单位为块,一块默认为512字节
上面两种方式可选其一。第一种无限制,第二种指定最大产生的大小。 调试 core 文件也很简单:
gdb 程序文件名 core文件名
具体可参看《linux 常用命令-开发调试篇》gdb 部分。
调试已运行程序
如果程序已经运行了怎么办呢? 首先使用 ps 命令找到进程 id:
ps -ef|grep 进程名
attach 方式
假设获取到进程 id 为 20829,则可用下面的方式调试进程:
$ gdb
(gdb) attach 20829
接下来就可以继续你的调试啦。
可能会有下面的错误提示:
Could not attach to process.  If your uid matches the uid of the target
process, check the setting of /proc/sys/kernel/yama/ptrace_scope, or try
again as the root user.  For more details, see /etc/sysctl.d/10-ptrace.conf
ptrace: Operation not permitted.
解决方法,切换到 root 用户: 将/etc/sysctl.d/10-ptrace.conf 中的
kernel.yama.ptrace_scope = 1
修改为
kernel.yama.ptrace_scope = 0
直接调试相关 id 进程
还可以是用这样的方式 gdb program pid,例如:
gdb hello 20829
或者:
gdb hello --pid 20829
已运行程序没有调试信息
为了节省磁盘空间,已经运行的程序通常没有调试信息。但如果又不能停止当前程序重新启动调试,那怎么办呢?还有办法,那就是同样的代码,再编译出一个带调试信息的版本。然后使用和前面提到的方式操作。对于 attach 方式,在 attach 之前,使用 file 命令即可:
$ gdb
(gdb) file hello
Reading symbols from hello...done.
(gdb)attach 20829
总结
本文主要介绍了两种类型的 GDB 启动调试方式,分别是调试未运行的程序和已经运行的程序。对于什么样的程序能够进行调试也进行了简单说明。
断点设置
前言
上篇《GDB 调试指南-启动调试》我们讲到了 GDB 启动调试的多种方式,分别应用于多种场景。今天我们来介绍一下断点设置的多种方式。
为何要设置断点
在介绍之前,我们首先需要了解,为什么需要设置断点。我们在指定位置设置断点之后,程序运行到该位置将会“暂停”,这个时候我们就可以对程序进行更多的操作,比如查看变量内容,堆栈情况等等,以帮助我们调试程序。
查看已设置的断点
在学习断点设置之前,我们可以使用 info breakpoints 查看已设置断点:
info breakpoints
Num     Type           Disp Enb Address            What
1       breakpoint     keep y   0x00000000004005fc in printNum2 at test.c:17
    breakpoint already hit 1 time
2       hw watchpoint  keep y                      a
    breakpoint already hit 1 time
    ignore next 3 hits
它将会列出所有已设置的断点,每一个断点都有一个标号,用来代表这个断点。例如,第 2 个断点设置是一个观察点,并且会忽略三次。
断点设置
断点设置有多种方式,分别应用于不同的场景。借助示例程序进行一一介绍:
//test.c
#include<stdio.h>
void printNum(int a)
{
    printf("printNum\n");
    while(a > 0)
    {
        printf("%d\n",a);
        a--;
    }
}
void printNum2(int a,int num)
{
    printf("printNum\n");
    while(a > num && a>0)
    {
        printf("%d\n",a);
        a--;
    }
}
int div(int a,int b)
{
    printf("a=%d,b=%d\n",a,b);
    int temp = a/b;
    return temp;
}
int main(int argc,char *argv[])
{
    printNum2(12,5);
    printNum(10);
    div(10,0);
    return 0;
}
编译:
gcc -g -o test test.c
注意,编译时需要带上-g 参数,具体原因参见《GDB 调试指南-启动调试》。
根据行号设置断点
b 9 #break 可简写为b
或者
b test.c:9
程序运行到第 9 行的时候会断住。
根据函数名设置断点
同样可以将断点设置在函数处:
b printNum
程序在调用到 printNum 函数的时候会断住。
根据条件设置断点
假设程序某处发生崩溃,而崩溃的原因怀疑是某个地方出现了非期望的值,那么你就可以在这里断点观察,当出现该非法值时,程序断住。这个时候我们可以借助 gdb 来设置条件断点,例如:
break test.c:23 if b==0
当在 b 等于 0 时,程序将会在第 23 行断住。 它和 condition 有着类似的作用,假设上面的断点号为 1,那么:
condition 1 b==0
会使得 b 等于 0 时,产生断点 1。而实际上可以很方便地用来改变断点产生的条件,例如,之前设置 b==0 时产生该断点,那么使用 condition 可以修改断点产生的条件。
根据规则设置断点
例如需要对所有调用 printNum 函数都设置断点,可以使用下面的方式:
rbreak printNum*
所有以 printNum 开头的函数都设置了断点。而下面是对所有函数设置断点:
#用法:rbreak file:regex
rbreak .
rbreak test.c:. #对test.c中的所有函数设置断点
rbreak test.c:^print #对以print开头的函数设置断点
设置临时断点
假设某处的断点只想生效一次,那么可以设置临时断点,这样断点后面就不复存在了:
tbreak test.c:l0 #在第10行设置临时断点
跳过多次设置断点
假如有某个地方,我们知道可能出错,但是前面 30 次都没有问题,虽然在该处设置了断点,但是想跳过前面 30 次,可以使用下面的方式:
ignore 1 30
其中,1 是你要忽略的断点号,可以通过前面的方式查找到,30 是需要跳过的次数。这样设置之后,会跳过前面 30 次。再次通过 info breakpoints 可以看到:
Num     Type           Disp Enb Address            What
1       breakpoint     keep y   0x00000000004005e8 in printNum2 at test.c:16
    ignore next 30 hits
根据表达式值变化产生断点
有时候我们需要观察某个值或表达式,知道它什么时候发生变化了,这个时候我们可以借助 watch 命令。例如:
watch a
这个时候,让程序继续运行,如果 a 的值发生变化,则会打印相关内容,如:
Hardware watchpoint 2: a
Old value = 12
New value = 11
但是这里要特别注意的是,程序必须运行起来,否则会出现:
No symbol "a" in current context.
因为程序没有运行,当前上下文也就没有相关变量信息。
rwatch 和 awatch 同样可以设置观察点前者是当变量值被读时断住,后者是被读或者被改写时断住。
禁用或启动断点
有些断点暂时不想使用,但又不想删除,可以暂时禁用或启用。例如:
disable  #禁用所有断点
disable bnum #禁用标号为bnum的断点
enable  #启用所有断点
enable bnum #启用标号为bnum的断点
enable delete bnum  #启动标号为bnum的断点,并且在此之后删除该断点
断点清除
断点清除主要用到 clear 和 delete 命令。常见使用如下:
clear   #删除当前行所有breakpoints
clear function  #删除函数名为function处的断点
clear filename:function #删除文件filename中函数function处的断点
clear lineNum #删除行号为lineNum处的断点
clear f:lename:lineNum #删除文件filename中行号为lineNum处的断点
delete  #删除所有breakpoints,watchpoints和catchpoints
delete bnum #删除断点号为bnum的断点
总结
本文介绍了常见的断点设置方法,断点设置之后,可以便于我们后期观察变量,堆栈等信息,为进一步的定位与调试做准备。
变量查看
前言
在启动调试以及设置断点之后,就到了我们非常关键的一步-查看变量。GDB 调试最大的目的之一就是走查代码,查看运行结果是否符合预期。既然如此,我们就不得不了解一些查看各种类型变量的方法,以帮助我们进一步定位问题。
准备工作
在查看变量之前,需要先启动调试并设置断点,该部分内容可参考《GDB 调试指南-启动调试》和《GDB 调试指南-断点设置》。后面的内容都基于在某个位置已经断住。
本文辅助说明程序如下: testGdb.c
//testGdb.c
#include<stdio.h>
#include<stdlib.h>
#include"testGdb.h"
int main(void)
{
    int a = 10; //整型
    int b[] = {1,2,3,5};  //数组
    char c[] = "hello,shouwang";//字符数组
    /*申请内存,失败时退出*/
    int *d = (int*)malloc(a*sizeof(int));
    if(NULL == d)
    {
        printf("malloc error\n");
        return -1;
    }
    /*赋值*/
    for(int i=0; i < 10;i++)
    {
        d[i] = i;
    }
    free(d);
    d = NULL;
    float e = 8.5f;
    return 0;
}
testGdb.h
int a = 11;
编译:
$ gcc -g -o testGdb testGdb.o
普通变量查看
打印基本类型变量,数组,字符数组
最常见的使用便是使用 print(可简写为 p)打印变量内容。 例如,打印基本类型,数组,字符数组等直接使用 p 变量名即可:
(gdb) p a
$1 = 10
(gdb) p b
$2 = {1, 2, 3, 5}
(gdb) p c
$3 = "hello,shouwang"
(gdb)
当然有时候,多个函数或者多个文件会有同一个变量名,这个时候可以在前面加上函数名或者文件名来区分:
(gdb) p 'testGdb.h'::a
$1 = 11
(gdb) p 'main'::b
$2 = {1, 2, 3, 5}
(gdb)
这里所打印的 a 值是我们定义在 testGdb.h 文件里的,而 b 值是 main 函数中的 b。
打印指针指向内容
如果还是使用上面的方式打印指针指向的内容,那么打印出来的只是指针地址而已,例如:
(gdb) p d
$1 = (int *) 0x602010
(gdb)
而如果想要打印指针指向的内容,需要解引用:
(gdb) p *d
$2 = 0
(gdb) p *d@10
$3 = {0, 1, 2, 3, 4, 5, 6, 7, 8, 9}
(gdb)
从上面可以看到,仅仅使用*只能打印第一个值,如果要打印多个值,后面跟上@并加上要打印的长度。 或者@后面跟上变量值:
(gdb) p *d@a
$2 = {0, 1, 2, 3, 4, 5, 6, 7, 8, 9}
(gdb)
由于 a 的值为 10,并且是作为整型指针数据长度,因此后面可以直接跟着 a,也可以打印出所有内容。
另外值得一提的是,$可表示上一个变量,而假设此时有一个链表 linkNode,它有 next 成员代表下一个节点,则可使用下面方式不断打印链表内容:
(gdb) p *linkNode
(这里显示linkNode节点内容)
(gdb) p *$.next
(这里显示linkNode节点下一个节点的内容)
如果想要查看前面数组的内容,你可以将下标一个一个累加,还可以定义一个类似 UNIX 环境变量,例如:
(gdb) set $index=0
(gdb) p b[$index++]
$11 = 1
(gdb) p b[$index++]
$12 = 2
(gdb) p b[$index++]
$13 = 3
这样就不需要每次修改下标去打印啦。
按照特定格式打印变量
对于简单的数据,print 默认的打印方式已经足够了,它会根据变量类型的格式打印出来,但是有时候这还不够,我们需要更多的格式控制。常见格式控制字符如下:
- x 按十六进制格式显示变量。
- d 按十进制格式显示变量。
- u 按十六进制格式显示无符号整型。
- o 按八进制格式显示变量。
- t 按二进制格式显示变量。
- a 按十六进制格式显示变量。
- c 按字符格式显示变量。
- f 按浮点数格式显示变量。
还是以辅助程序来说明,正常方式打印字符数组 c:
(gdb) p c
$18 = "hello,shouwang"
但是如果我们要查看它的十六进制格式打印呢?
(gdb) p/x c
$19 = {0x68, 0x65, 0x6c, 0x6c, 0x6f, 0x2c, 0x73, 0x68, 0x6f, 0x75, 0x77, 0x61,
  0x6e, 0x67, 0x0}
(gdb)
但是如果我们想用这种方式查看浮点数的二进制格式是怎样的是不行的,因为直接打印它首先会被转换成整型,因此最终会得到 8:
(gdb) p e
$1 = 8.5
(gdb) p/t e
$2 = 1000
(gdb)
那么就需要另外一种查看方式了。
查看内存内容
examine(简写为 x)可以用来查看内存地址中的值。语法如下:
x/[n][f][u] addr
其中:
- n 表示要显示的内存单元数,默认值为 1
- f 表示要打印的格式,前面已经提到了格式控制字符
- u 要打印的单元长度
- addr 内存地址
单元类型常见有如下:
- b 字节
- h 半字,即双字节
- w 字,即四字节
- g 八字节
我们通过一个实例来看,假如我们要把 float 变量 e 按照二进制方式打印,并且打印单位是一字节:
(gdb) x/4tb &e
0x7fffffffdbd4:    00000000    00000000    00001000    01000001
(gdb)
可以看到,变量 e 的四个字节都以二进制的方式打印出来了。
自动显示变量内容
假设我们希望程序断住时,就显示某个变量的值,可以使用 display 命令。
(gdb) display e
1: e = 8.5
那么每次程序断住时,就会打印 e 的值。要查看哪些变量被设置了 display,可以使用:
(gdb)info display
Auto-display expressions now in effect:
Num Enb Expression
1:   y  b
2:   y  e
如果想要清除可以使用
delete display num #num为前面变量前的编号,不带num时清除所有。
或者去使能:
disable display num #num为前面变量前的编号,不带num时去使能所有
查看寄存器内容
(gdb)info registers
rax            0x0    0
rbx            0x0    0
rcx            0x7ffff7dd1b00    140737351850752
rdx            0x0    0
rsi            0x7ffff7dd1b30    140737351850800
rdi            0xffffffff    4294967295
rbp            0x7fffffffdc10    0x7fffffffdc10
(内容过多未显示完全)
总结
通过不同方式查看变量值或者内存值能够极大的帮助我们判断程序的运行是否符合我们的预期,如果发现观察的值不是我们预期的时候,就需要检查我们的代码了。
单步调试
前言
前面通过《启动调试》,《断点设置》,《变量查看》,我们已经了解了 GDB 基本的启动,设置断点,查看变量等,如果这些内容你还不知道,建议先回顾一下前面的内容。在启动调试设置断点观察之后,没有我们想要的信息怎么办呢?这个时候,就需要单步执行或者跳过当前断点继续执行等等。而本文所说的单步调试并非仅仅指单步执行,而是指在你的控制之下,按要求执行语句。
准备
老规矩,先准备一个示例程序如下:
/*gdbStep.c*/
#include<stdio.h>
/*计算简单乘法,这里没有考虑溢出*/
int add(int a, int b)
{
    int c = a + b;
    return c;
}
/*打印从0到num-1的数*/
int count(int num)
{
    int i = 0;
    if(0 > num)
        return 0;
    while(i < num)
    {
        printf("%d\n",i);
        i++;
    }
    return i;
}
int main(void)
{
    int a = 3;
    int b = 7;
    printf("it will calc a + b\n");
    int c = add(a,b);
    printf("%d + %d = %d\n",a,b,c);
    count(c);
    return 0;
}
编译:
gcc -g -o gdbStep gdbStep.c
程序的功能比较简单,这里不多做解释。
特别简单说明一条命令,list(可简写为 l),它可以将源码列出来,例如:
(gdb) list
1    #include<stdio.h>
2
3    /*计算简单乘法,这里没有考虑溢出*/
4    int add(int a, int b)
5    {
6        int c = a * b;
7        return c;
8    }
9    int main(void)
10    {
(gdb) l
11        int a = 13;
12        int b = 57;
13        printf("it will calc a * b\n");
14        int c = add(a,b);
15        printf("%d*%d = %d\n",a,b,c);
16        return 0;
17    }
(gdb)
单步执行-next
next 命令(可简写为 n)用于在程序断住后,继续执行下一条语句,假设已经启动调试,并在第 12 行停住,如果要继续执行,则使用 n 执行下一条语句,如果后面跟上数字 num,则表示执行该命令 num 次,就达到继续执行 n 行的效果了:
$ gdb gdbStep   #启动调试
(gdb)b 25       #将断点设置在12行
(gdb)run        #运行程序
Breakpoint 1, main () at gdbStep.c:25
25        int b = 7;
(gdb) n     #单步执行
26        printf("it will calc a + b\n");
(gdb) n 2   #执行两次
it will calc a + b
28        printf("%d + %d = %d\n",a,b,c);
(gdb)
从上面的执行结果可以看到,我们在 25 行处断住,执行 n 之后,运行到 26 行,运行 n 2 之后,运行到 28 行,但是有没有发现一个问题,为什么不会进入到 add 函数内部呢?那就需要用到另外一个命令啦。
单步进入-step
对于上面的情况,如果我们想跟踪 add 函数内部的情况,可以使用 step 命令(可简写为 s),它可以单步跟踪到函数内部,但前提是该函数有调试信息并且有源码信息。
$ gdb gdbStep    #启动调试
(gdb) b 25       #在12行设置断点
Breakpoint 1 at 0x4005d3: file gdbStep.c, line 25.
(gdb) run        #运行程序
Breakpoint 1, main () at gdbStep.c:25
25        int b = 7;
(gdb) s
26        printf("it will calc a + b\n");
(gdb) s     #单步进入,但是并没有该函数的源文件信息
_IO_puts (str=0x4006b8 "it will calc a + b") at ioputs.c:33
33    ioputs.c: No such file or directory.
(gdb) finish    #继续完成该函数调用
Run till exit from #0  _IO_puts (str=0x4006b8 "it will calc a + b")
    at ioputs.c:33
it will calc a + b
main () at gdbStep.c:27
27        int c = add(a,b);
Value returned is $1 = 19
(gdb) s        #单步进入,现在已经进入到了add函数内部
add (a=13, b=57) at gdbStep.c:6
6        int c = a + b;
从上面的过程可以看到,s 命令会尝试进入函数,但是如果没有该函数源码,需要跳过该函数执行,可使用 finish 命令,继续后面的执行。如果没有函数调用,s 的作用与 n 的作用并无差别,仅仅是继续执行下一行。它后面也可以跟数字,表明要执行的次数。
当然它还有一个选项,用来设置当遇到没有调试信息的函数,s 命令是否跳过该函数,而执行后面的。默认情况下,它是会跳过的,即 step-mode 值是 off:
(gdb) show step-mode
Mode of the step operation is off.
(gdb) set step-mode on
(gdb) set step-mode off
还有一个与 step 相关的命令是 stepi(可简写为 si),它与 step 不同的是,每次执行一条机器指令:
(gdb) si
0x0000000000400573    6        int c = a + b;
(gdb) display/i $pc
1: x/i $pc
=> 0x400573 <add+13>:    mov    -0x18(%rbp),%eax
(gdb)
继续执行到下一个断点-continue
我们可能打了多处断点,或者断点打在循环内,这个时候,想跳过这个断点,甚至跳过多次断点继续执行该怎么做呢?可以使用 continue 命令(可简写为 c)或者 fg,它会继续执行程序,直到再次遇到断点处:
$ gdb gdbStep
(gdb)b 18    #在count函数循环内打断点
(gdb)run
Breakpoint 1, count (num=10) at gdbStep.c:18
18            i++;
(gdb) c      #继续运行,直到下一次断住
Continuing.
1

Breakpoint 1, count (num=10) at gdbStep.c:18
18            i++;
(gdb) fg     #继续运行,直到下一次断住
Continuing.
2

Breakpoint 1, count (num=10) at gdbStep.c:18
18            i++;
(gdb) c 3    #跳过三次
Will ignore next 2 crossings of breakpoint 1.  Continuing.
3
4
5

Breakpoint 1, count (num=10) at gdbStep.c:18
18            i++;
继续运行到指定位置-until
假如我们在 25 行停住了,现在想要运行到 29 行停住,就可以使用 until 命令(可简写为 u):
$ gdb gdbStep
(gdb)b 25
(gdb)run
(gdb) u 29
it will calc a + b
3 + 7 = 10
main () at gdbStep.c:29
29        count(c);
(gdb)
可以看到,在执行 u 29 之后,它在 29 行停住了。它利用的是临时断点。
跳过执行—skip
skip 可以在 step 时跳过一些不想关注的函数或者某个文件的代码:
$ gdb gdbStep
(gdb) b 27
Breakpoint 1 at 0x4005e4: file gdbStep.c, line 27.
(gdb) skip function add    #step时跳过add函数
Function add will be skipped when stepping.
(gdb) info skip   #查看step情况
Num     Type           Enb What
1       function       y   add
(gdb) run
Starting program: /home/hyb/workspaces/gdb/gdbStep
it will calc a + b

Breakpoint 1, main () at gdbStep.c:27
27        int c = add(a,b);
(gdb) s
28        printf("%d + %d = %d\n",a,b,c);
(gdb)
可以看到,再使用 skip 之后,使用 step 将不会进入 add 函数。 step 也后面也可以跟文件:
(gdb)skip file gdbStep.c
这样 gdbStep.c 中的函数都不会进入。
其他相关命令:
- skip delete [num] 删除 skip
- skip enable [num] 使能 skip
- skip disable [num] 去使能 skip
其中 num 是前面通过 info skip 看到的 num 值,上面可以带或不带该值,如果不带 num,则针对所有 skip,如果带上了,则只针对某一个 skip。
总结
本文主要介绍了一些简单情况的单步调试方法或常见命令使用,但这些已经够用了,毕竟大部分程序的执行或停止都在我们的掌控之中了。
源码查看
前言
我们在调试过程中难免要对照源码进行查看,如果已经开始了调试,而查看源码或者编辑源码却要另外打开一个窗口,那未免显得太麻烦。文本将会介绍如何在 GDB 调试模式下查看源码或对源码进行编辑。
准备工作
为了说明后面的内容,我们先准备一些源码,分别是 main.c:
//main.c
#include<stdio.h>
#include"test.h"
int main(void)
{
    printf("it will print from 5 to 1\n");
    printNum(5);
    printf("print end\n");

    printf("it will print 1 to 5\n");
    printNum1(5);
    printf("print end\n");
    return 0;
}
头文件 test.h:
#ifndef _TEST_H
#define _TEST_H
#include<stdio.h>
void printNum(int n);
void printNum1(int n);
#endif
以及 test.c:
#include"test.h"
void printNum(int n)
{
    if( n < 0)
        return;
    while(n > 0)
    {
        printf("%d\n",n);
        n--;
    }
}

void printNum1(int n)
{
    if( n < 0)
        return;
    int i = 1;
    while(i <= n)
    {
        printf("%d\n",i);
        i++;
    }
}
编译运行:
$ gcc -g  -o main  main.c test.c
$ chmod +x main
$ ./main
it will print from 5 to 1
5
4
3
2
1
print end
it will print 1 to 5
1
2
3
4
5
print end
程序功能比较简单,用来打印 5 到 1 的数以及 1 到 5 的数,这里也就不多做解释。
列出源码
首先要介绍的就是 list 命令(可简写为 l),它用来打印源码。
直接打印源码
例如:
$ gdb main
(gdb) l
1    //main.c
2    #include<stdio.h>
3    #include"test.h"
4    int main(void)
5    {
6        printf("it will print from 5 to 1\n");
7        printNum(5);
8        printf("print end\n");
9
10        printf("it will print 1 to 5\n");
(gdb)
直接输入 l 可从第一行开始显示源码,继续输入 l,可列出后面的源码。后面也可以跟上+或者-,分别表示要列出上一次列出源码的后面部分或者前面部分。
列出指定行附近源码
l 后面可以跟行号,表明要列出附近的源码:
(gdb) l 9
4    int main(void)
5    {
6        printf("it will print from 5 to 1\n");
7        printNum(5);
8        printf("print end\n");
9
10        printf("it will print 1 to 5\n");
11        printNum1(5);
12        printf("print end\n");
13        return 0;
在这里,l 后面跟上 9,表明要列出第 9 行附近的源码。
列出指定函数附近的源码
这个很容易理解,而使用也很简单,l 后面跟函数名即可,例如:
(gdb) l printNum
1    #include"test.h"
2    void printNum(int n)
3    {
4        if( n < 0)
5            return;
6        while(n > 0)
7        {
8            printf("%d\n",n);
9            n--;
10        }
在这里,l 后面跟上函数名 printNum,它便列出了 printNum 函数附近的源码。
设置源码一次列出行数
不知道你有没有发现,在列出函数源码的时候,它并没有列全,因为 l 每次只显示 10 行,那么有没有方法每次列出更多呢? 我们可以通过 listsize 属性来设置,例如设置每次列出 20 行:
(gdb) set listsize 20
(gdb) show listsize
Number of source lines gdb will list by default is 20.
这样每次就会列出 20 行,当然也可以设置为 0 或者 unlimited,这样设置之后,列出就没有限制了,但源码如果较长,查看将会不便。
列出指定行之间的源码
list first,last 例如,要列出 3 到 15 行之间的源码:
(gdb) l 3,15
3    {
4        if( n < 0)
5            return;
6        while(n > 0)
7        {
8            printf("%d\n",n);
9            n--;
10        }
11    }
12
13    void printNum1(int n)
14    {
15        if( n < 0)
启始行和结束行号之间用逗号隔开。两者之一也可以省略,例如:
(gdb) list 3,
3    {
4        if( n < 0)
5            return;
6        while(n > 0)
7        {
8            printf("%d\n",n);
9            n--;
10        }
11    }
12
省略结束行的时候,它列出从开始行开始,到指定大小行结束,而省略开始行的时候,到结束行结束,列出设置的大小行,例如默认设置为 10 行,则到结束行为止,总共列出 10 行。前面我们也介绍了修改和查看默认列出源码行数的方法。
列出指定文件的源码
前面执行 l 命令时,默认列出 main.c 的源码,如果想要看指定文件的源码呢?可以
l location
其中 location 可以是文件名加行号或函数名,因此可以使用:
(gdb) l test.c:1
1    #include"test.h"
2    void printNum(int n)
3    {
4        if( n < 0)
5            return;
6        while(n > 0)
7        {
8            printf("%d\n",n);
9            n--;
10        }
(gdb)
来查看指定文件指定行,或者指定文件指定函数:
(gdb) l test.c:printNum1
9            n--;
10        }
11    }
12
13    void printNum1(int n)
14    {
15        if( n < 0)
16            return;
17        int i = 1;
18        while(i <= n)
(gdb)
或者指定文件指定行之间:
(gdb) l test.c:1,test.c:3
1    #include"test.h"
2    void printNum(int n)
3    {
(gdb)
指定源码路径
在查看源码之前,首先要确保我们的程序能够关联到源码,一般来说,我们在自己的机器上加上-g 参数编译完之后,使用 gdb 都能查看到源码,但是如果出现下面的情况呢?
源码被移走
例如,我现在将 main.c 移动到当前的 temp 目录下,再执行 l 命令:
(gdb) l
1    main.c: No such file or directory.
(gdb)
它就会提示找不到源码文件了,那么怎么办呢? 我们可以使用 dir 命名指定源码路径,例如:
(gdb) dir ./temp
Source directories searched: /home/hyb/workspaces/gdb/sourceCode/./temp:$cdir:$cwd
这个时候它就能找到源码路径了。我这里使用的是相对路径,保险起见,你也可以使用绝对路径。
更换源码目录
例如,你编译好的程序文件,放到了另外一台机器上进行调试,或者你的源码文件全都移动到了另外一个目录,怎么办呢?当然你还可以使用前面的方法添加源码搜索路径,也可以使用 set substitute-path from to 将原来的路径替换为新的路径,那么我们如何知道原来的源码路径是什么呢?借助 readelf 命令可以知道:
$ readelf main -p .debug_str
  [     0]  long unsigned int
  [    12]  short int
  [    1c]  /home/hyb/workspaces/gdb/sourceCode
  [    40]  main.c
(显示部分内容)
main 为你将要调试的程序名,这里我们可以看到原来的路径,那么我们现在替换掉它:
(gdb) set substitute-path /home/hyb/workspaces/gdb/sourceCode /home/hyb/workspaces/gdb/sourceCode/temp
(gdb) show substitute-path
List of all source path substitution rules:
  `/home/hyb/workspaces/gdb/sourceCode' -> `/home/hyb/workspaces/gdb/sourceCode/temp'.
(gdb)
设置完成后,可以通过 show substitute-path 来查看设置结果。这样它也能在正确的路径查找源码啦。
需要注意的是,这里对路径做了字符串替换,那么如果你有多个路径,可以做多个替换。甚至可以对指定文件路径进行替换。
最后你也可以通过 unset substitute-path [path]取消替换。
编辑源码
为了避免已经启动了调试之后,需要编辑源码,又不想退出,可以直接在 gdb 模式下编辑源码,它默认使用的编辑器是/bin/ex,但是你的机器上可能没有这个编辑器,或者你想使用自己熟悉的编辑器,那么可以通过下面的方式进行设置:
$ EDITOR=/usr/bin/vim
$ export EDITOR
/usr/bin/vim 可以替换为你熟悉的编辑器的路径,如果你不知道你的编辑器在什么位置,可借助 whereis 命令或者 witch 命令查看:
$ whereis vim
vim: /usr/bin/vim /usr/bin/vim.tiny /usr/bin/vim.basic /usr/bin/vim.gnome /etc/vim /usr/share/vim /usr/share/man/man1/vim.1.gz
$ which vim
/usr/bin/vim
设置之后,就可以在 gdb 调试模式下进行编辑源码了,使用命令 edit location,例如:
(gdb)edit 3  #编辑第三行
(gdb)edit printNum #编辑printNum函数
(gdb)edit test.c:5 #编辑test.c第五行
可自行尝试,这里的 location 和前面介绍的一样,可以跟指定文件的特定行或指定文件的指定函数。 编辑完保存后,别忘了重新编译程序:
(gdb)shell gcc -g -o main main.c test.c
这里要注意,为了在 gdb 调试模式下执行 shell 命令,需要在命令之前加上 shell,表明这是一条 shell 命令。这样就能在不用退出 GDB 调试模式的情况下编译程序了。
另外一种模式
启动时,带上 tui(Text User Interface)参数,会有意想不到的效果,它会将调试在多个文本窗口呈现:
gdb main -tui
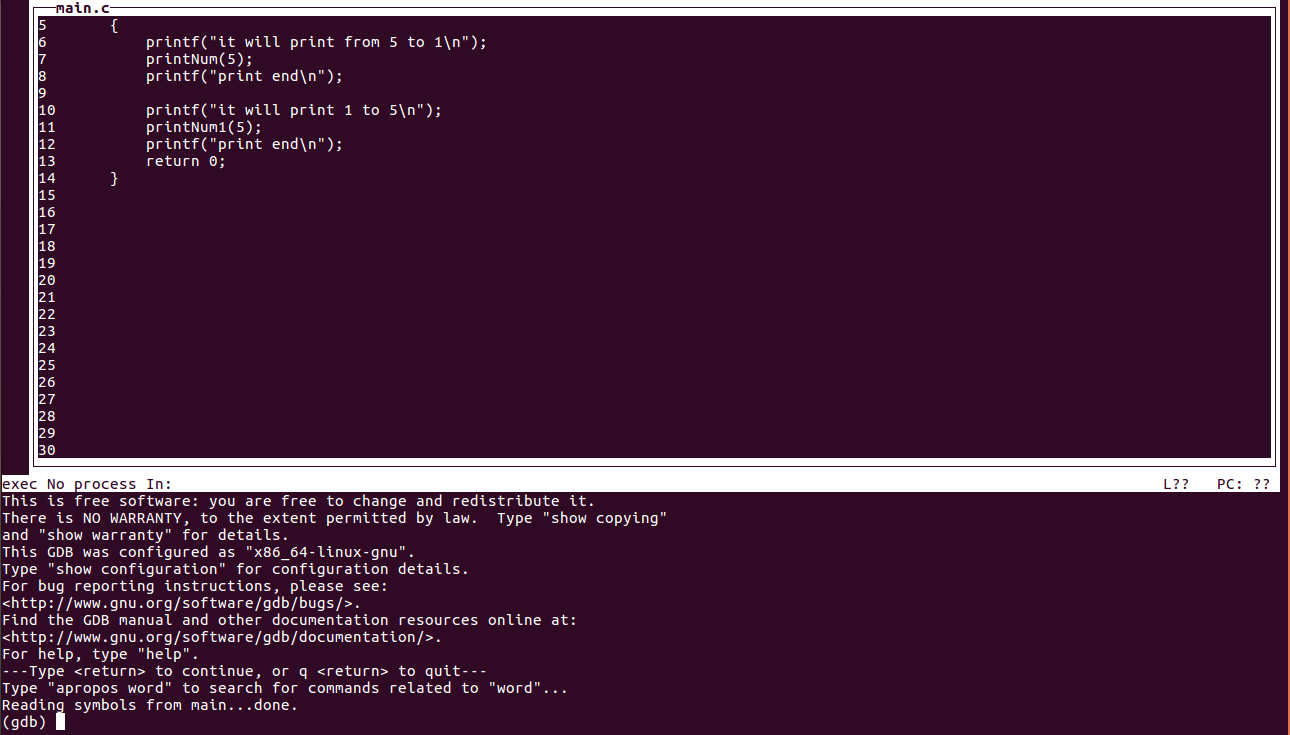
但是本文不作介绍,有兴趣的可以探索一下。
总结
本文介绍了 GDB 调试中的源码查看,源码编辑以及如何在 GDB 调试模式下执行 shell 命令。